The Great Depression had high unemployment, famine, and poverty. An estimated one-third of Americans were destitute, including three out of four senior citizens. As a result, the Social Security Act passed in 1935, and the Fair Labor Standards Act (FLSA) passed in 1938.
The FLSA attempted to improve the environment for workers laboring for low pay and long hours under unsafe conditions. Large swaths of laborers struggled to feed, clothe or house their families. Despite opposition from business, courts and legislators, the FLSA set a $0.25 minimum wage. It established protocols for overtime pay, record keeping, and child labor.
When first enacted, it applied to workers and companies engaged in interstate commerce – about 20% of the labor force. It exempted professional, administrative, and executive “white collar workers”. It would take another quarter century before amendments were passed to extend coverage to include:
- 1961 – retail, transit, and construction sectors
- 1966 hospitals, hotels, farm and local government workers, among others
Today, most workers are covered. There are dispensations for workers under 20, tip-earners (restaurants), and Americans with disabilities.
In its first 43 years of existence, there were 15 increases in the minimum wage from $0.25 to $3.35. In the last 44 years to the present, there have been 7 increases from $3.80 to $7.25. Minimum wage increases have diminished in frequency and have failed to keep pace with inflation.
Minimum Wage Purchasing Power
The Bureau of Labor Statistic (BLS) publishes the CPI (consumer price index). This metric tracks how “a basket of goods” typically purchased by consumers changes over time. The BLS website includes an inflation calculator. We used this tool to estimate the purchasing power of the nominal minimum wage at different points in time.
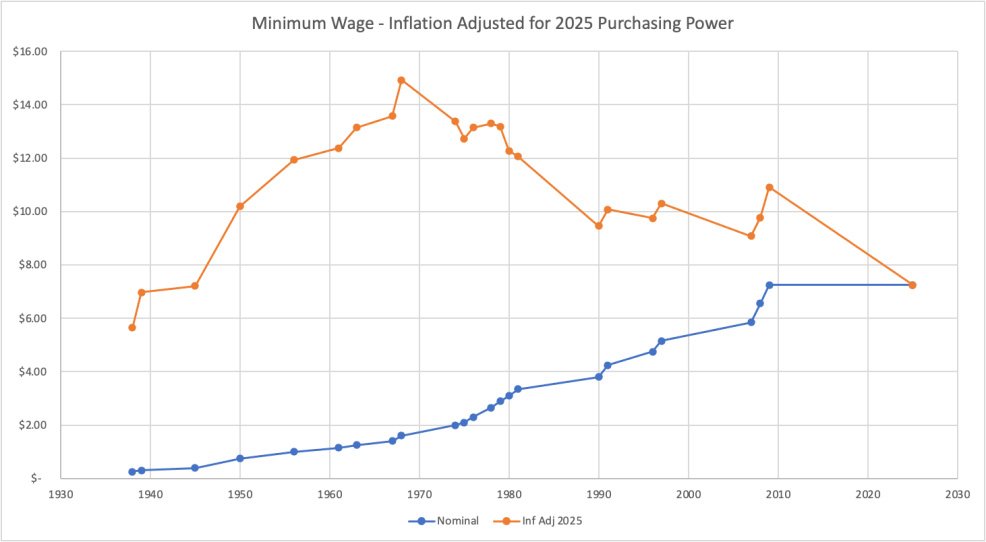
From the graph above, we see the minimum wage peaked in purchasing power in 1968. The $1.60 rate is equivalent to a wage of $14.92 in 2025 dollars. The last minimum wage increase occurred in 2009. There has been inflation since 2009. The CPI indicates $7.25 sixteen years ago (the last minimum wage increase) is worth $10.91 today in 2025.
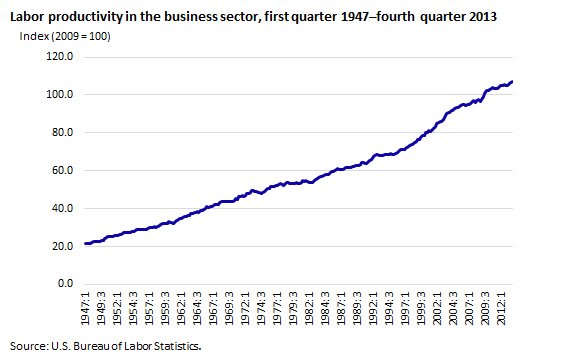
Labor Productivity and Pay
Labor productivity compares output (adjusted for inflation) to total labor hours worked. When output grows faster than labor, that is considered a gain in labor productivity. Economic data of the past three-quarter century inform us:
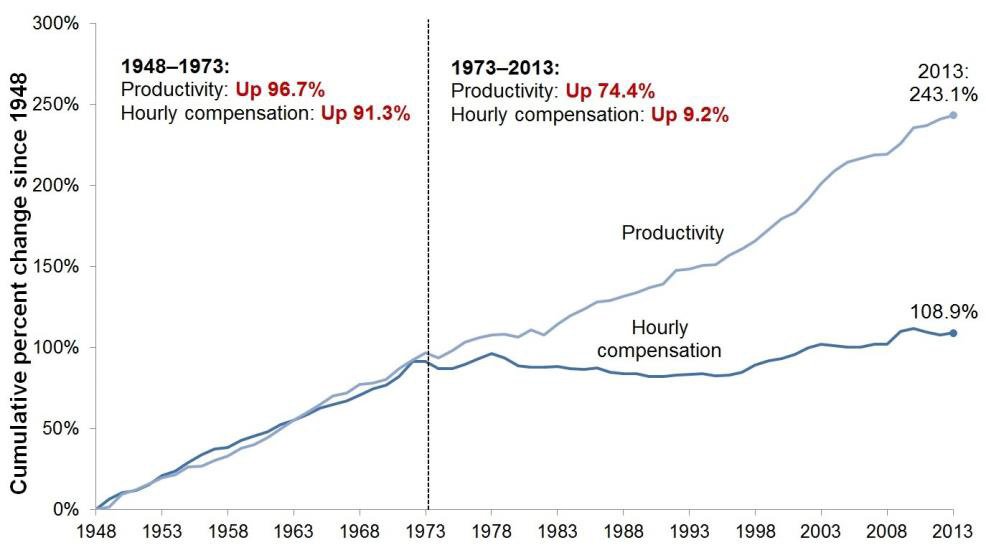
The Economic Policy Institute published statistics comparing hourly labor compensation and productivity in the United States from 1948 to 2013. From 1948 to 1973, the hourly labor compensation and productivity gains were closely aligned: 91% compared to 97%. From 1973 to 2013, the hourly compensation increase of 9 percent lagged productivity gain of 74 percent. The disconnect between compensation and productivity is a major factor in income inequality between labor and owners of capital.
Poverty Line Versus Living Wages
The poverty line is a calculation of the minimum cost of necessities such as food, housing, and clothing required by an individual for a given location. Its composition is inexact. Nevertheless, applying a constant standard of what people reasonably need provides a basis for comparison.
The poverty threshold, on average, in the United States for 2025 per the Census Bureau is:
| Household Size | Poverty Line |
|---|---|
| 1 | $15,650 |
| 2 | $21,150 |
| 3 | $26,250 |
| 4 | $32,150 |
For a one-year period or 52 weeks, the required hourly wage to reach the poverty line would be:
- $7.52 for a 40-hours work week
- $8.60 @ 35 hours
- $10.03 @ 30 hours
The $7.52 calculated for a 40-hour work week exceeds the federal minimum wage by 4%. 52 weeks of work year implies no vacation. The poverty line varies based upon geography-driven housing costs. States like Hawaii or Alaska or cities like New York or Los Angeles have poverty lines that are higher by 10%, 20% or more.
Federal gridlock has the minimum wage stuck in neutral. As a result, 30 states have set their own minimum wages above the federal level to avoid poverty-wage implications.
| State | Minimum Wage | Future Increases Slated |
|---|---|---|
| Alabama | $7.25 | |
| Alaska | $11.91 | * |
| Arizona | $14.70 | |
| Arkansas | $11.00 | |
| California | $16.50 | |
| Colorado | $14.81 | |
| Connecticut | $16.35 | |
| Delaware | $15.00 | |
| District of Columbia | $17.50 | * |
| Florida | $17.95 | * |
| Georgia | $7.25 | |
| Hawaii | $14.00 | * |
| Idaho | $7.25 | |
| Illinois | $15.00 | |
| Indiana | $7.25 | |
| Iowa | $7.25 | |
| Kansas | $7.25 | |
| Kentucky | $7.25 | |
| Louisiana | $7.25 | |
| Maine | $14.65 | |
| Maryland | $15.00 | |
| Massachusetts | $15.00 | |
| Michigan | $10.56 | * |
| Minnesota | $11.13 | |
| Mississippi | $7.25 | |
| Missouri | $13.75 | |
| Montana | $10.55 | |
| Nebraska | $13.50 | * |
| Nevada | $12.00 | |
| New Hampshire | $7.25 | |
| New Jersey | $15.49 | |
| New Mexico | $12.00 | |
| New York | $15.50 | |
| North Carolina | $7.25 | |
| North Dakota | $7.25 | |
| Ohio | $10.70 | |
| Oklahoma | $7.25 | |
| Oregon | $14.70 | * |
| Pennsylvania | $7.25 | |
| Rhode Island | $15.00 | |
| South Carolina | $7.25 | |
| South Dakota | $11.50 | |
| Tennessee | $7.25 | |
| Texas | $7.25 | |
| Utah | $7.25 | |
| Vermont | $14.01 | |
| Virginia | $12.41 | |
| Washington | $16.66 | |
| West Virginia | $8.75 | |
| Wisconsin | $7.25 | |
| Wyoming | $7.25 |
What Does This Add Up To?
The number of workers who earn the minimum wage is difficult to estimate since 29 states and the District of Columbia have rates that exceed the federal minimum. This site reports a total of 1.82 million laborers at minimum wage.
According to Oxfam, 58.3 million workers earn less than $15 per hour, including 41.7 million who earn less than $12 per hour.
Had the minimum wage been indexed to inflation, it would be ~$15.
If you add the real gain in productivity as well, the minimum wage would be another 65% higher or about $25. See Wages versus Productivity from 1973 to 2013 as discussed above.
How large is the transfer of wealth from laborers to the owners of capital had the minimum wage kept pace with inflation or inflation plus productivity?
We can multiply the number of workers by the differential in wages paid.
Using an inflation indexed wage of $15:
| # workers | Wage Gap | Hourly Total | Weekly Total | Annual Total |
|---|---|---|---|---|
| 1.82 million | $7.75 | $14 million | $564 million | $29.3 billion |
| 41.7 million | $3.00 | $125 million | $5.0 billion | $260.2 billion |
| 58.3 million | $0.00 | $0 | $0 | $0 |
Using the inflation indexed wage grossed up for productivity gains of $25:
| # workers | Wage Gap | Hourly Total | Weekly Total | Annual Total |
|---|---|---|---|---|
| 1.82 million | $17.75 | $32 million | $1.3 billion | $67.1 billion |
| 41.7 million | $13.00 | $542 million | $21.7 billion | $1.1 trillion |
| 58.3 million | $10.00 | $583 million | $23.3 billion | $1.2 trillion |
The tables above indicate a wealth transfer from labor to capital in the billions, if not trillions. This data prompts many questions such as: Should the federal minimum be indexed to inflation or productivity?

- How many workers make $7.75 compared to the number of workers between $8 and $12?
- Do these hourly wages include tips?
- What about benefits or tax savings?
These issues are worth examining. It is possible that there is more in-depth data that is or can be gathered by the Census Bureau or Bureau of Labor Statistics. With that said, having a minimum wage that remains constant despite gains in productivity as well as erosion from inflation translates into a transfer of wealth in billions, if not trillions of dollars, each year from workers to owners. When this dynamic is compounded each year for decades, is it any wonder that the United States has the largest maldistribution of wealth ever recorded?
| Year | Top 1% Assets ($Trillions) | Bottom 50% Assets ($Trillions) |
|---|---|---|
| 1990 | 4.9 | 0.8 |
| 2000 | 11.3 | 1.3 |
| 2010 | 17.9 | 0.2 |
| 2020 | 37.8 | 2.7 |
| 2025 - Q1 | 49.4 | 4.0 |
In the United States, the:
- top 1% own 50% of equities
- bottom 50% own 1% of equities
When you do the math, for every $1 stock market gain enjoyed by one person in the bottom 50%, 1 person in the top 1% enjoys a $2,500 gain. That is ownership of 50:1 compared to the number of people of 1:50.
50 / (1/50) which is 50 * 50 or 2,500
Are policies that are popularly supported more likely to be codified into law compared to preferences that are sponsored by the concentrated wealth of the donor class? Does the media treat issues impacting the have-nots in a way different from issues impacting the haves?
The former is addressed in a 2004 study from Princeton University and the latter will be further examined in this post.
Some economic debate for or against higher minimum wage
An economic argument against increasing the minimum wage claims that higher wages depress employment and dampen profits. Proponents posit that the concept of supply and demand is applicable to labor markets.
Empirically, do we see a shortage of McDonald’s in states with a $15 minimum wage compared to those states with a $7.25 minimum wage?
In 2016, Reuters published an article examining Walmart. The analysis included the following data:
- 979,000 employees @ $10 per hour
- Revenue $482 billion
- Profit $15 billion
A raise to $15 per hour would cost Walmart $5 per hour per employee. That amounts to $10.3 billion for a year of 40-hour work weeks for 979,000 employees. $10.3 billion in added costs would lower their profits by 65%. But, increasing revenue of $482 billion by 2% through, say, price increases, would restore that lost profit.
It is worth noting that there are claims that Walmart’s business model is structurally supported by taxpayers due to wages that are too low:
Among the findings is that Walmart receives an estimated $6.2 billion annually in mostly federal taxpayer subsidies. The reason: Walmart pays its employees so little that many of them rely on food stamps, Medicaid and six other taxpayer-funded programs.
According to posts on Reddit:
My niece got hired at Walmart a couple years ago. Her new employee training included a class on how to apply for food stamps and Medicaid.
Similar complaints are made against other large enterprises such as McDonald’s and Amazon. These entities have responded by raising their wages in select areas. They are still profitable. Anecdotally, this challenges the claim of pending economic collapse from a raised minimum wage.
Statutory Aim and Effectiveness
The minimum wage laws were created to ensure a basic standard of living for workers. The argument for it has always been to help the working poor escape poverty and to avoid work weeks of 60 hours or more.
Historically, the United States enjoyed its highest growth while the minimum wage was growing at its fastest rate. Empirically, we see that some of the largest corporations continue to generate record profits despite raising compensation to hourly staff either due to political pressure (the fight for $15 movement) or labor market tightening (during Covid-19). Prices could be adjusted, productivity enhanced, or the could “trickle up”.
There have been studies that indicate that higher pay results in:
- More discretionary income and therefore more spending on goods and services
- Reduced absences or downtime
- Less stress
- Increased productivity
- Fewer distractions
For example, not having to work a second job means less time traveling, more time spent recuperating from a day’s work, or increased flexibility to attend family matters such as parent-teacher meetings. Workplaces that have unions produce benefits for non-union workers as well as higher wages, increased benefits, or safer workspaces.
The federal minimum wage has not increased since 2009 despite inflation and increased worker productivity. This has resulted in workers living below the poverty line or seeking more hours of work from multiple jobs.
What should be the standard? The question depends somewhat on normative values. But as the richest country (of possibly all time), does it make sense to fantasize about the first trillionaire while there are millions suffering from homelessness, food insecurity or lacking medical insurance? What happens when a large middle class is replaced by a large underclass? How sustainable is that social environment?